INTRODUCTION
Rationale:- The network has become of great importance in every field. We must ensure network performance and security, prevent network problems, conduct effective troubleshooting and take actions quickly to solve possible problems.
In today’s world as many websites are hosted by the companies/industries/organizations. So, these companies are responsible for any type of error found during hosting of particular websites. To detect the corresponding errors we need WEBSITE MONITORING. Corresponding types of errors are described later in the report.
The fundamental purpose or rationale to make this project is to make cumbersome task of website hoster or organization to monitor each and every website easily.
Problem Domain:-
• As Corporate and Business engage the web more and more heavily, the need to ensure a website is up at all time becomes more critical and it results in website up time performance degradation and availability.
• A Website, which falls to deliver its content either in a timely manner or at all, causes visitors to quickly lose interest, wasting the time and money invested in Website development.
• It’s very tedious for a website host to check manually each and every website he/she is hosting.
• Further, the process of checking is to be repeated again after certain interval.
• Calculating the number of Website that are working & not-Working is quiet difficult if total is very high. Further reporting error to clients or contacting client whose website is not working make the process even intricate.
• Client must be keen to know how often this error comes. He may want logs satisfying his needs.
• Calculating traffic/load on each hosted website is quiet difficult.
Solution Domain:-
By getting knowledge from this process of monitoring we create a perspective that if we implement this process of monitoring into desktop tools which can be apply to a server computer in an organization to monitor several websites hosted.
This tool helps server to regular check corresponding list websites to overcome time consumption problem. This tool monitors the uptime, downtime, port, website status (active or not), if not active than what type of error occurred. Then the server will take severe actions to overcome these errors and become aware of lost business.
Solution:-
• To overcome the problem, a technique can be used that monitor websites performance. WebMon (a tool) is used to avoid, minimized downtime, and keep the server running.
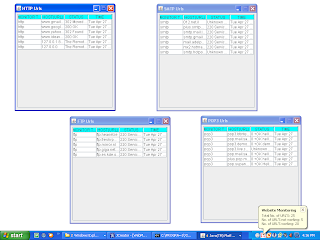
• Web Mon checks number of websites in a particular interval of time and find out the status of websites, as they are active or not. If not, it gives kind of error and displays the time and date.
• For the companies with internal hosting capability or with number of servers hosted in a data center somewhere, then WebMon strategy is a good tool.
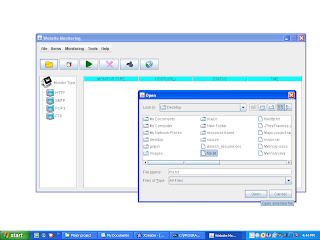
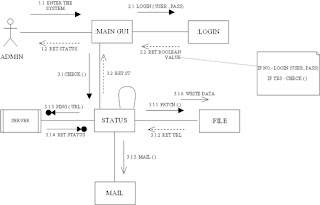
• It checks list of websites stored in a text file and will directly access this file and will ping each URL in the list.
• As this is desktop tool it's light & fast application as compared to websites that provide this service.
Features of the System:-
• Monitor Any Web Application with Ease.
• Monitor from an Authentic End User Perspective.
• WebMon is not just about web pages it gives you information of problems related to SMTP, DNS, FTP, HTTP..etc.
• Alerts are provided after a particular time in system tray and for further error e-mail is sent to the webmaster about the error.
• 24x7 remote monitoring.
• Purpose-specific monitoring services.
• Detects the type of error


